Hubtel’s Observability Journey: How We Enhanced Performance and Reliability
December 18, 2024 | 10 minutes read
In our mission to drive Africa forward by enabling everyone to find and pay for everyday essentials, gaining deep insights into our platform’s operations is crucial. As the platform continues to grow, encompassing various product lines and accommodating an increasing customer base, understanding its underpinnings becomes essential.
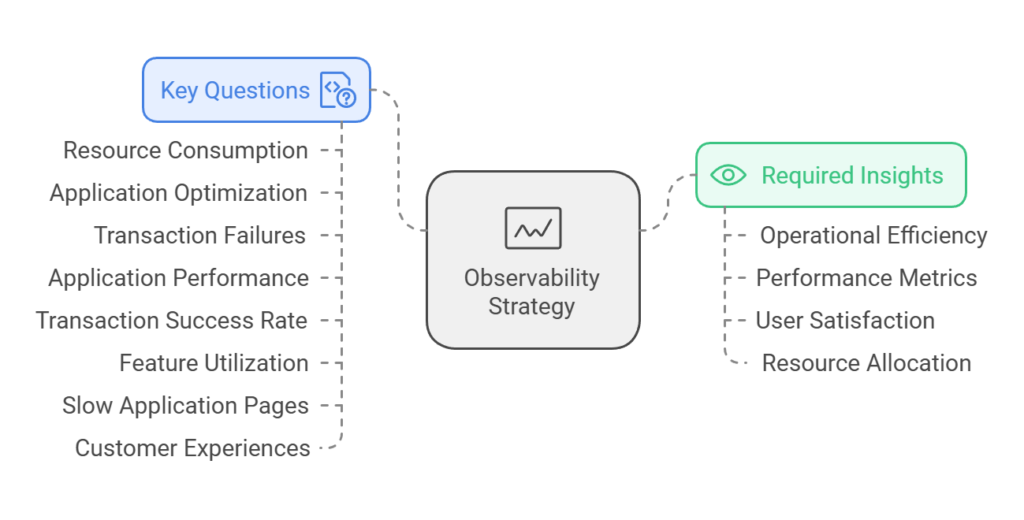
In the process of gaining understanding in real-time, some key questions that various interested parties are looking for answers, include:
- What is the resource consumption of the platform?
- Which application should we optimize?
- Which transactions are failing and what is causing it?
- How are applications performing individually and as a platform?
- How many transactions are processed successfully in any give elapse of time?
- Which feature set is under-utilized and why?
- Which application pages are slow and why?
- What are the customer experiences across the platform?
To answer these questions and more, a robust software observability strategy is required.
READ ALSO: From Snail Mail to Warp Speed: How Hubtel Rocketed Its Product Delivery
What is Observability?
Observability is the process of understanding what’s happening inside a system based on its external outputs. It refers to the ability to infer the internal states of a system from the data it produces.
This capability is crucial for gaining insights into complex, distributed systems, often uncovering unknown issues or behaviours on our platform. Observability emphasizes a holistic understanding of the system’s behaviour.
Highlights of Observability
The benefits of adopting this approach include:
- Operational Excellence: Our systems are not only operational but also measurable, debuggable, and performant.
- Empowered Engineering: As engineers, we are empowered to diagnose, predict, and resolve issues on our platform quickly and effectively, ensuring an always-available platform for our customers.
- Informed Decision-Making: We are well-equipped to support our product managers and research analysts in understanding user behavior on our platform, providing key insights to improve our product experiences.
With observability, we shift from being reactive to proactive. This approach allows us to detect and resolve issues before they affect users, identify opportunities to optimize performance, and gather insights to enhance overall reliability.
Observability is essential for supporting continuous improvement in our software lifecycle, enabling data-driven decisions and fostering accountability.
Types of Telemetry Signals
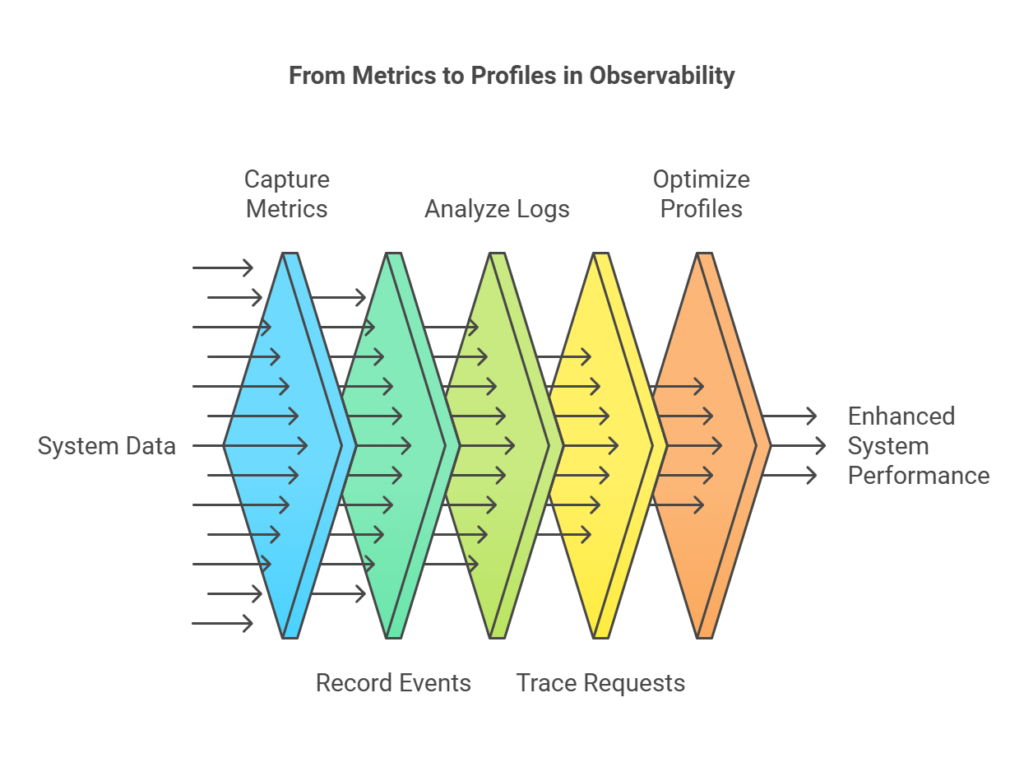
Telemetry signals can be categorized into:
| Metrics: Numeric measurements like CPU usage, memory consumption, and request rates, providing a high-level view of system health. | Example: Monitoring the average CPU usage of a server over time to ensure it remains within acceptable limits. |
| Events: Discrete actions occurring in the system at any time. | Example: A user logging into the platform or a payment transaction being initiated. |
| Logs: Detailed records of system events, capturing activities, errors, and transactions for debugging. | Example: An error log capturing a failed database query with details about the error and the time it occurred. |
| Traces: Track the flow of requests across services, helping identify bottlenecks in distributed systems. | Example: Tracing a user request from the frontend service through various backend services to identify where delays occur. |
| Profiles: Insights into resource usage and performance, identifying hotspots and optimizing code. | Example: Profiling a web application to find functions that consume the most CPU time and optimizing them for better performance. |
Gen Alpha of Our Observability Journey
The problem of instituting a robust observability solution, just like with every problem here at Hubtel, has gone through a series of solution iterations and refinements in a bid to identify the solution which adequately meets our aims.
Our current observability solution can be broken into several parts which address different needs of our business, namely:
- User Events Analytics: This component focuses on capturing and analysing user interactions with our platform. By understanding user behaviour, we can enhance user experience, identify popular features, and detect any issues that users may encounter. Tracking user navigation paths to identify common drop-off points in the user journey. We leverage tools like Google Analytics, Mixpanel, Microsoft Clarity and other in house developed tools to capture and analyse user events, providing insights into user behaviour and engagement.
- Transaction Monitoring: Ensuring the reliability and performance of financial transactions is critical. This part of our observability solution monitors transaction success rates, failure rates, and processing times to ensure smooth and secure payment experiences. Monitoring the success rate of payment transactions to quickly identify and resolve any issues that may arise. We use tools such as StatsD and Grafana to monitor transaction metrics and visualize performance data, enabling us to quickly detect and address transaction issues.
- Infrastructure Monitoring: Our platform’s infrastructure must be robust and scalable to handle increasing loads. This component monitors the health and performance of our servers, databases, and network to ensure they are operating efficiently. Keeping track of server CPU and memory usage to prevent resource exhaustion and maintain optimal performance. Tools like Nagios and New Relic help us monitor infrastructure health, providing alerts and dashboards to keep track of resource usage and system performance.
- Application Monitoring: This part focuses on the performance and health of our applications. By monitoring application metrics, logs, and traces, we can quickly identify and resolve issues, ensuring our applications run smoothly and efficiently. Using traces to identify slow-performing API endpoints and optimizing them for better performance. We utilize Application Insights and New Relic for tracing Graylogs and ELK Stack (Elasticsearch, Logstash, Kibana) for log aggregation and analysis, to gain deep insights into application performance.
By integrating these components into our observability strategy, we have gain comprehensive insights into our platform’s operations, proactively address issues, and continuously improve our services for our customers.
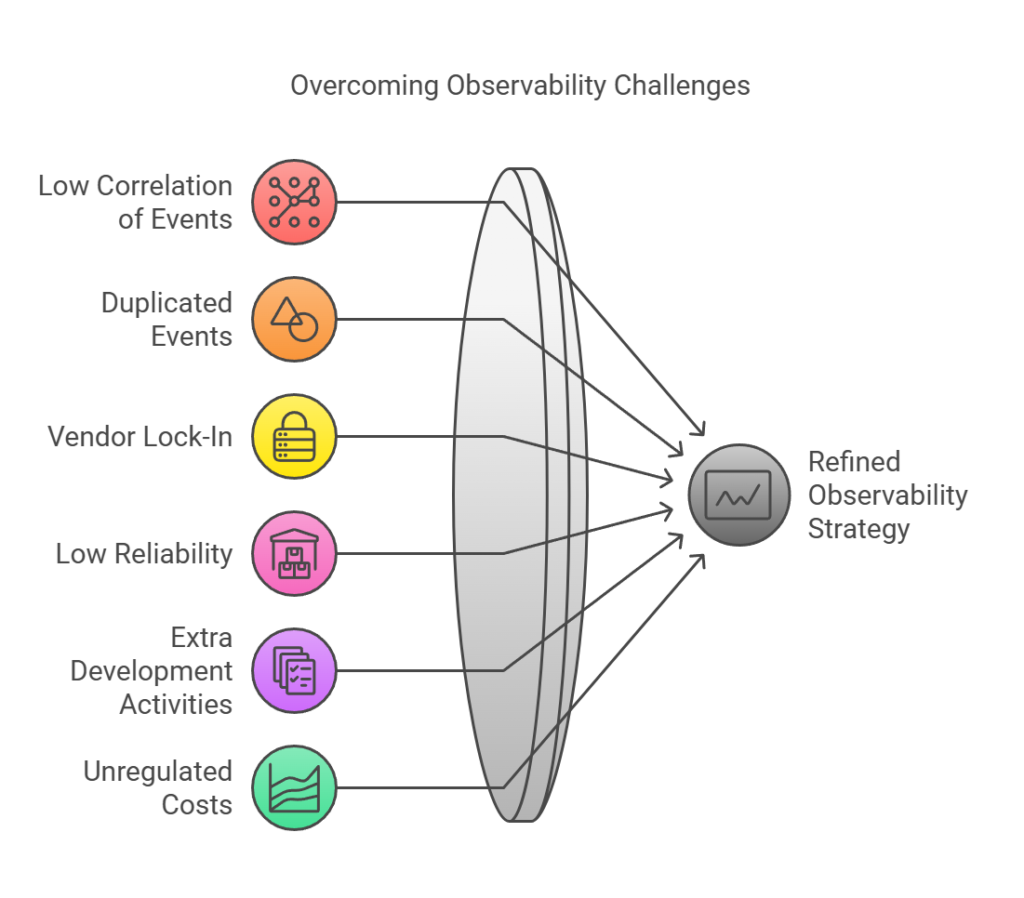
However, this approach has come with its own challenges, such as:
- Low Correlation of Events: Using different monitoring systems often makes it difficult to correlate related events across systems. This relies heavily on skilled personnel to draw such relations, and when they fail, it results in undesired system outcomes.
- Duplicated Events: The decentralized nature of our observability solution leads to a single event being recorded in multiple monitoring systems, resulting in redundancy and increased costs for managing and storing these events.
- Vendor Lock-In: Some monitoring tools require tight coupling with our services, limiting our flexibility and increasing costs. Switching providers or integrating new tools becomes challenging.
- Low Reliability: Managing multiple solutions means handling various instances that hold key transaction information, which can hinder timely issue resolution.
- Extra Development Activities: Setting up and maintaining monitoring systems requires additional effort, delaying deployments and increasing the workload for engineering teams.
- Unregulated Costs: The costs associated with observability systems can be unpredictable and escalate quickly, impacting budget planning and resource allocation, especially when using different independent tools.
Addressing these challenges is crucial for refining our observability strategy and ensuring it effectively supports our platform’s growth and reliability.
Gen Omega of Our Observability Journey
An effective observability strategy encompasses qualities such as simple tooling, cost-effective storage, and proactive alert and monitoring systems.
So, in the next generation of our journey, we have adopted the use of OpenTelemetry.
OpenTelemetry is an open-source observability framework designed to provide a standardized way to collect, process, and export telemetry data such as metrics, logs, and traces.
It is a collaborative project under the Cloud Native Computing Foundation (CNCF) and has quickly become the industry standard for observability due to its flexibility, interoperability, and comprehensive feature set.
It contains:
- APIs and SDKs: OpenTelemetry provides language-specific APIs and SDKs that developers can use to instrument their applications. These tools enable the collection of telemetry data without being tied to a specific vendor or backend.
- Instrumentation Libraries: These libraries automatically capture telemetry data from popular frameworks and libraries, reducing the need for manual instrumentation.
- Collectors: OpenTelemetry Collectors are agents that receive, process, and export telemetry data. They can be deployed as standalone agents or as part of a larger observability pipeline.
- Exporters: Exporters are plugins that send telemetry data to various backends, such as Prometheus, Jaeger, Zipkin, and commercial observability platforms. This flexibility allows organizations to choose the best tools for their needs without being locked into a single vendor.
- Semantic Conventions: OpenTelemetry defines a set of semantic conventions to standardize the naming and structure of telemetry data. This ensures consistency and makes it easier to analyse data across different systems and tools.
The benefits we derive from using this approach include:
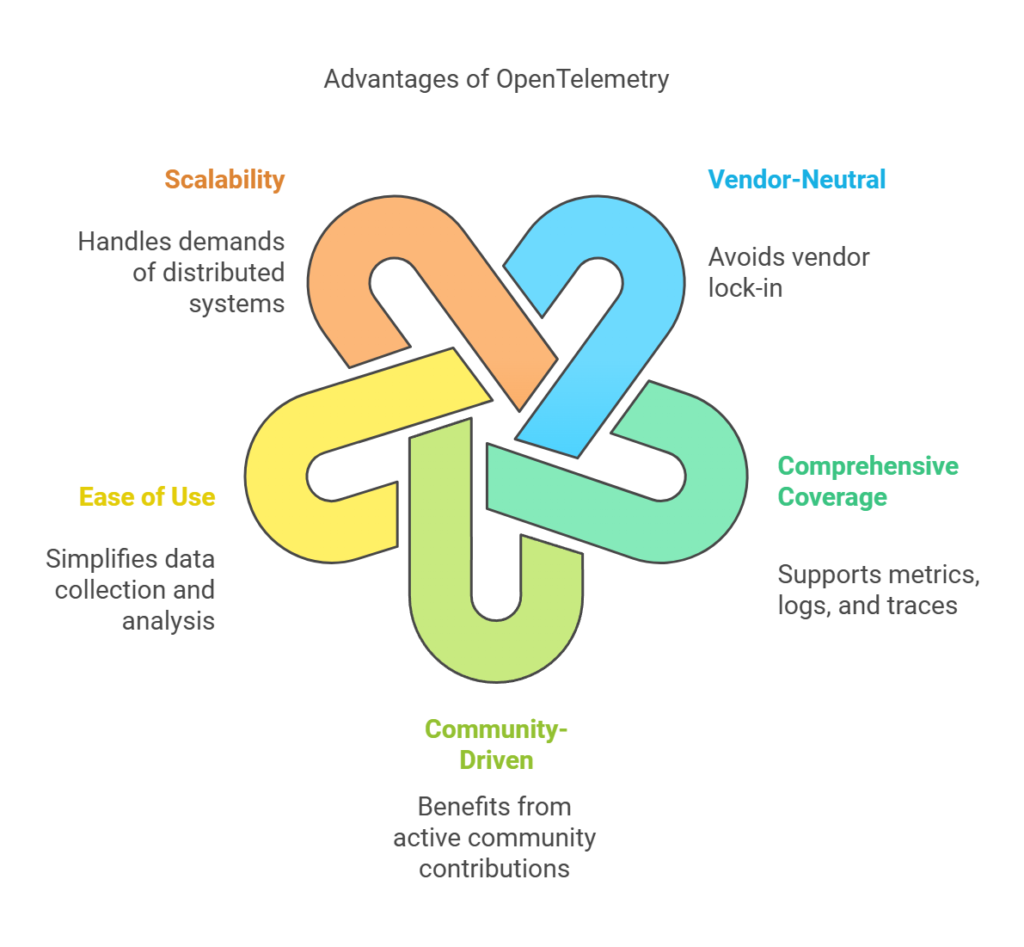
- Vendor-Neutral: OpenTelemetry’s vendor-neutral approach allows organizations to avoid vendor lock-in and switch between observability platforms with minimal effort.
- Comprehensive Coverage: By supporting metrics, logs, and traces, OpenTelemetry provides a holistic view of system performance and behaviour.
- Community-Driven: As an open-source project, OpenTelemetry benefits from contributions and innovations from a large and active community.
- Ease of Use: With automatic instrumentation and a unified API, OpenTelemetry simplifies the process of collecting and analysing telemetry data.
- Scalability: OpenTelemetry is designed to handle the demands of modern, distributed systems, making it suitable for organizations of all sizes.
By integrating OpenTelemetry with observability backends like Honeycomb, New Relic, DataDog, or Grafana, we can establish a comprehensive observability strategy.
This integration ensures complete oversight of our platform, covering transaction monitoring, infrastructure health, application performance, and user events.
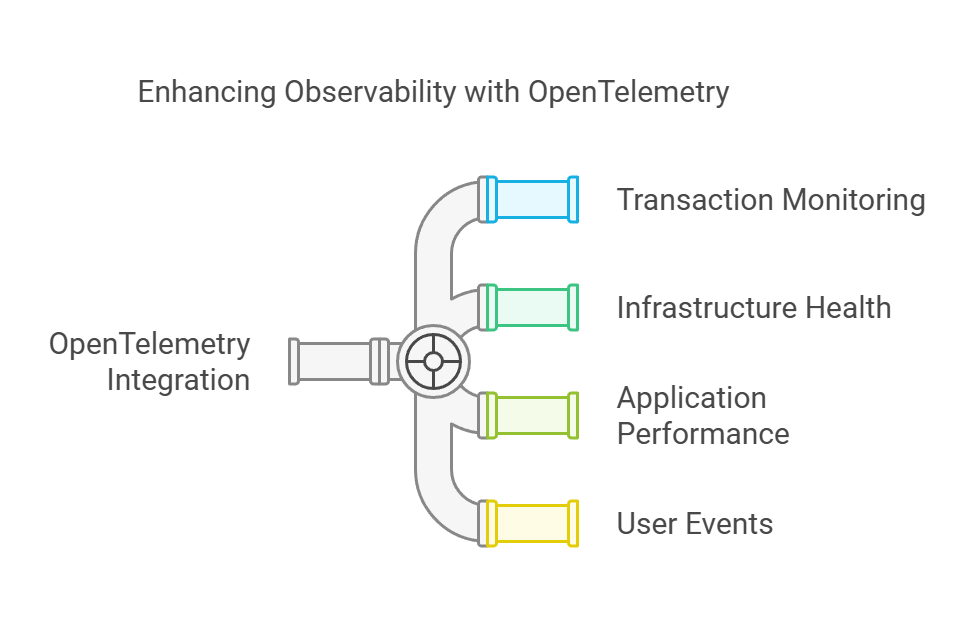
Adopting OpenTelemetry allows us to gain deep insights into our platform, enhance reliability, and improve the overall user experience.
Frontend observability is another aspect of our strategy essential for understanding user interactions and ensuring smooth, responsive, and error-free experiences on our platform.
By focusing on real user behavior and browser-side performance, it bridges the gap between backend operations and user experiences.
Key components include Core Web Vitals, Real User Monitoring (RUM), Session Replay, Synthetic Monitoring, Error Monitoring, and User Perception Metrics. These tools help measure performance, detect errors, and optimize workflows, ensuring our platform remains reliable and user-friendly.
Through proactive monitoring and analysis, we can swiftly address issues and enhance user satisfaction, aligning with our mission to drive Africa forward.
READ ALSO: Beyond Instinct: How the Code Confidence Index (CCI) is Transforming Code Quality at Hubtel
Conclusion
Hubtel’s journey towards a robust observability strategy has been marked by continuous improvement and adaptation.
By leveraging OpenTelemetry, we aim to overcome the challenges of our previous approaches and build a more cohesive, scalable, and cost-efficient observability framework.
This transition not only enhances our ability to monitor and optimize our platform but also empowers our engineering teams to deliver superior user experiences.
As we continue to evolve, our commitment to observability will remain a cornerstone of our mission to drive Africa forward, ensuring that we can proactively address issues, make informed decisions, and maintain the highest standards of operational excellence.
Authors

Kennedy Yaw Lodonu
Engineering Manager for Code Quality and Tooling
Related
Hubtel Attains ISO 27001:2022 Certification
February 24, 2025| 2 minutes read
Beyond Instinct: How the Code Confidence Index (CCI) is Transforming Code Quality at Hubtel
February 24, 2025| 6 minutes read
From Snail Mail to Warp Speed: How Hubtel Rocketed Its Product Delivery
February 18, 2025| 7 minutes read


